These days, thanks to the distance learning experiment just about every teacher and student has been managing, there has been a huge and continuous discussion surrounding equity. Obviously, students now need technology (Internet access in particular) in order to continue learning and it didn’t take long for all of us to remember that’s not always a guarantee. While equity is the topic of this week’s Rising Resources blog, we’re stepping a bit back from talking about it in the sense that it’s been talked about over the last couple of months and introducing you to a tool called Equity Maps—one teachers can use to help close the participation gap in class.
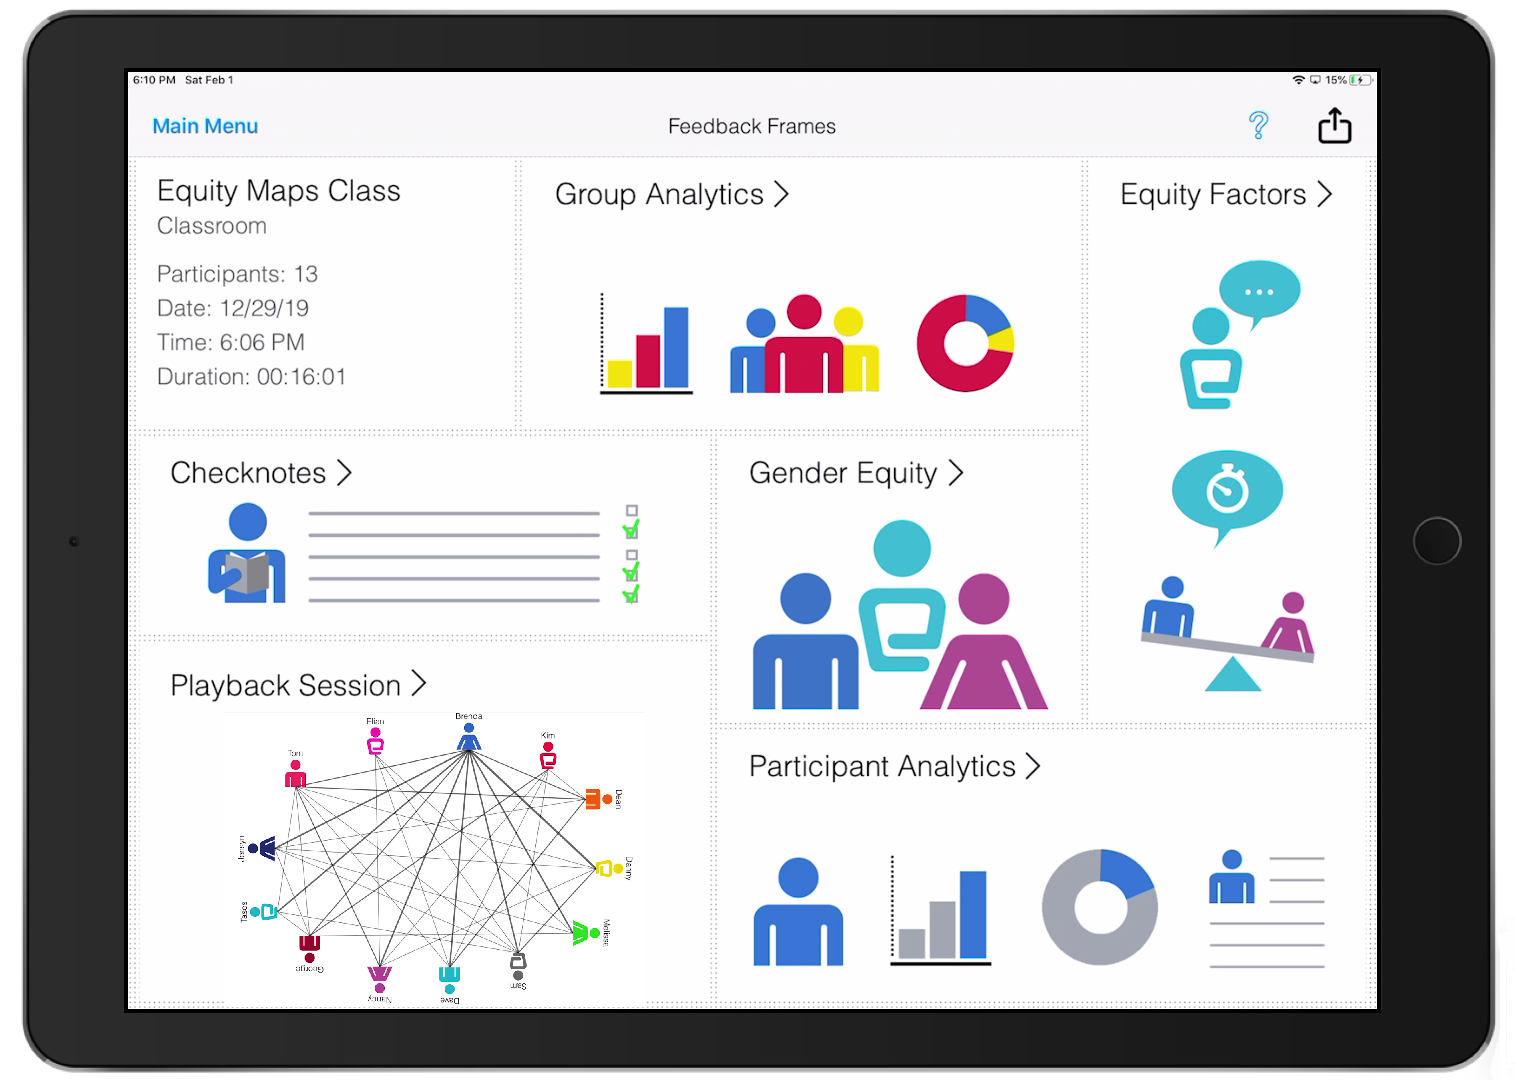
Equity Maps is a mobile application that teachers can download onto an iPad and use to help learn about who’s participating in lessons thanks to real data. It’s an iOS app and ideal for any educator who’s interested in monitoring student interaction and measuring participation. Since it captures useful data when it comes to participation, Equity Maps is great for educators who teach subjects that lead to a lot of thoughtful discussions or require greater levels of participation and engagement from students.
Only one iPad per group is needed to use Equity Maps and it does not require that students all create their own accounts. With the standard version, teachers can track and map up to 20 students and this version is currently free for a limited time. With the premium version, educators can track up to 40 students and access other features, like notes, templates, and customizable layouts. On the Equity Maps website, there are detailed set-up videos available for educators to make use of once they’ve created their account—resources that are quite helpful.
Ultimately, teachers can use Equity Maps to track and assess interaction levels from different students and determine how those participation levels affect their performance. By knowing how much students are involved in important classroom discussions, educators can tailor the feedback they give them to help them adjust their participation or maintain what they’re doing well. The goal is to get to a point at which all students are participating equally, the equity within the classroom is noticeable, and everybody gets the chance to share their thoughts.
The analytics insights that Equity Maps offers also allows teachers to break participation down by group, by participant, and even by gender. It shows when any one person is doing a lot of talking as well as when somebody else who may have a lot of ideas of their own isn’t necessarily sharing too many. And, by the same token, it can also provide data when it comes to how much the teacher is speaking and what percentage of class time teacher talk accounts for. Of course, this can be used by the teacher to adjust his or her lessons and either allow more time for student input or less—depending on what they learn from the data.

Beyond that, the notes feature within the premium version of Equity Maps allows teachers to track the nature of each student’s contributions—not just simply the fact of whether or not they are contributing. Various templates within this version make it easy for educators to track student performance and they can download the data then quickly generate an Excel sheet. The app organizes data into a graphical format, which makes it easy for teachers to recognize patterns and discover how they can move towards greater equity going forward.
Among some of its other benefits, teachers can use the analytics to provide quicker and more effective feedback for their students. Knowing who speaks a lot and who should offer more insights allows educators to also steer classroom discussions toward those students and possibly focus more on topics they’re most familiar with. This can also help teachers set some clear participation goals and help students see what they can do to achieve them.
Since Equity Maps provides classroom teachers with a visual representation of where participation in each classroom is coming from, it is certainly an eye-opening tool. A lot of the time, teachers who use Equity Maps are surprised by just how much data is captured and, more importantly, what it reveals about student participation. They can use Equity Maps, for example, to show school administrators the progress they’ve made with their students when it comes to increasing equity by recording what participation was like at the start of using the tool and what it was like a few weeks in, offering a sort of baseline indicator.
There really are a variety of features packed into the Equity Maps mobile app, including some we didn’t get to cover. Class set-up is quick, playback options are available (in real time or fast forward), teachers can choose to play audio from individual participants, and more! If this sounds like a tool that would be useful in your classroom, we encourage you to check out Equity Maps to learn more about it! Be sure to visit our EdTech store as well and give us a follow on Twitter and Instagram for all of the latest excitement from the EdTech world.


